COPEWELL
The Challenge
The Composite of Post Event Well-Being (COPEWELL) project — part of the Johns Hopkins Center for Public Health Preparedness — uses an evidenced-based approach to help communities improve their resilience to disasters. For the project to be successful, complex data had to be presented in an accessible format to a broad audience with varied expertise.
Strategy
When you’re tasked with a data visualization project, it’s tempting to go the bells and whistles route and produce a complicated, impressive looking, but ultimately useless tool. Instead, the idfive team focused on function. In researching our primary audience — government agencies and departments at the township, city, or county level — it was clear that the majority of end-users would not have a background in disaster research or system dynamics. So, even though we were dealing exclusively with data, we had to make the raw numbers secondary to what those numbers meant.
Whenever possible, we provided context, anticipated questions, and connected results with actionable next steps. For example: A low value for this measure means that [name of county] is scoring in the bottom third with regards to Recovery compared to other census areas. Efforts should be made to strengthen this value.
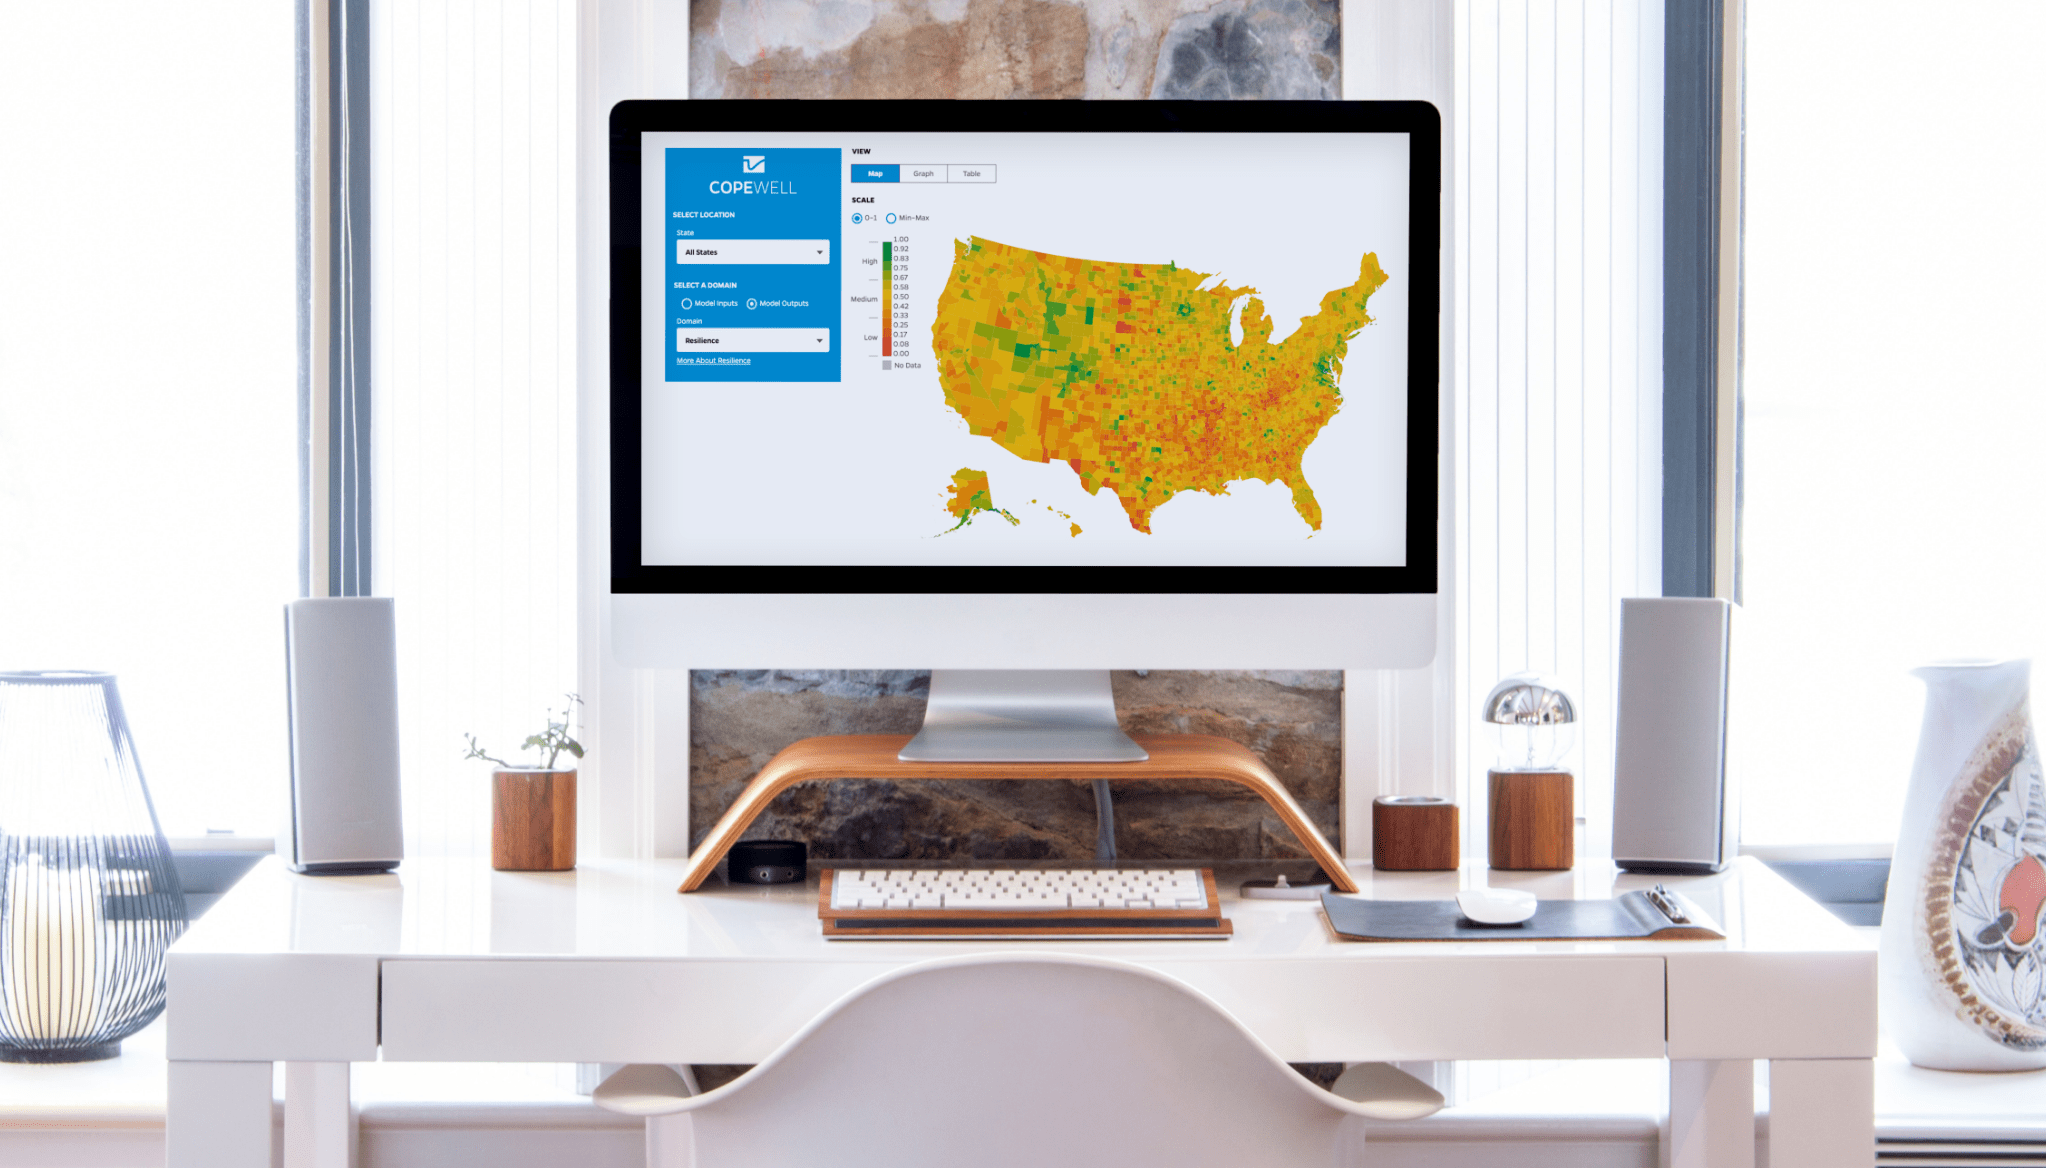
To ensure that the tool met the needs of both the primary audience (local government agencies) and secondary audiences (federal government agencies and NGOs), data was presented by county and state as well as nationally.
It was equally important to describe and label the data so that it was easily understandable, including definitions where appropriate.
Complex data sets were presented in clear categories — model inputs and model outputs — with domains and definitions supplied for each category.
43Validated measures in COPEWELL’s modeling toolI loved getting in the weeds of how this tool worked, particularly on something where the potential impact is so significant. The interactivity is the ‘wow’ factor, helping policymakers make decisions to improve our lives.
UX Design
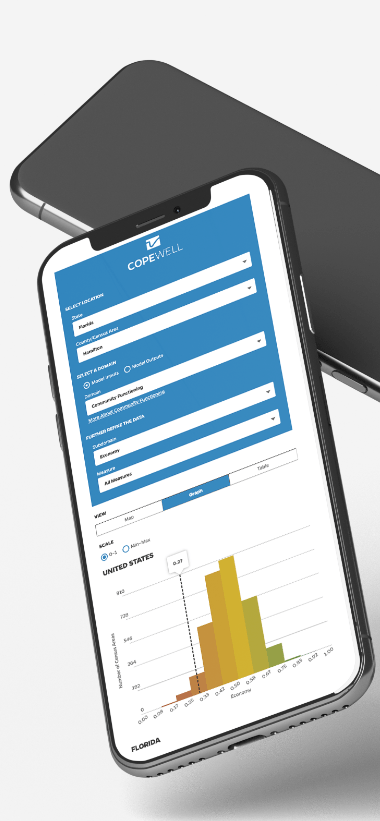
Whenever there is data, there is a tremendous opportunity to tell a data story. We worked closely with our client to intimately understand every facet of the data so that we could engineer a data-powered interactive storytelling telling platform. In the end, we gave users the ability to author their own macro and micro story through discovery. The final expression is a user-centric tool that can be interrogated in multiple formats, including visualized and structured data.
Development
The idfive development team wrote a data processing application that does a minimum of 496,436 calculations ahead of time, so those values aren’t calculated every time a new user loads the page. The application then assigns the proper color value to every data point inside of every census area.
The Result
An accessible tool puts the power of data into the hands of community leaders and policymakers to improve community functioning and resilience to disasters.
There’s amazing potential for good in the world.